
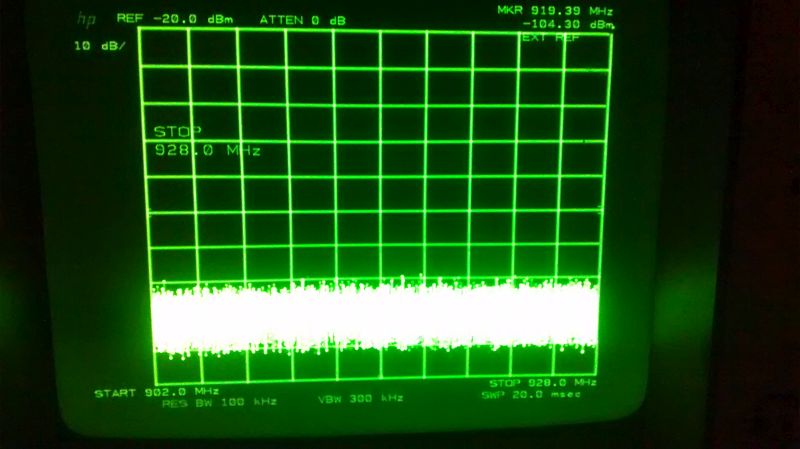
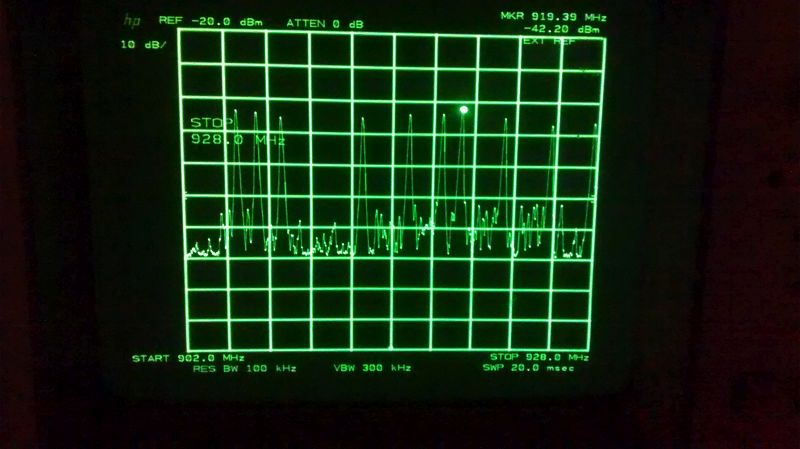
Some of you may know I did a survey of 900MHz recently, along with the real-world modem tests. The spectrum analyzer inside the modem showed a very dire picture of the band, with the noise floor averaging about -60dBm. Today, in preparation for 1.2GHz antenna installs, I ran some coax to the roof and was able to see the 900MHz vertical there directly on a proper spectrum analyzer. The spectrum story is quite different! Here's a view of a typical spectrum from 902-928MHz: floor The reference line at the top is -20dBm and each vertical graticule is 10dB. The noise floor looks to be about 7 graticules below -20dBm, or -90dBm. There is about 2dB loss in the 45ft feedline, so let's call the floor -88dBm. There are however some sparse transmissions in this band. I wish I could find a way to measure their duty cycle or plot their average power. Sadly the best I can do is to record their maximum power using the peak-hold mode of the spectrum analyzer. I captured about a 10 minute sample of air time, and here are the results: peaks The bright dot is the peak marker, and it reads -42dBm, which is really -40dBm at the antenna after you account for the coax loss. The peaks are all suspiciously uniform in power, so this may be a single transmitter just jumping around the spectrum with each burst. I can't explain why the Mikrotik 9HPn reports such a vastly different spectrum. It may be mixing the 860-900MHz cell band into the 900MHz band? I need to perform some further tests to figure this out. There are definitely strong signals in the 860-900MHz range (not shown in these photos). --Bart